Note
Go to the end to download the full example code.
Sound speeds#
Compute the “equilibrium” and “frozen” sound speeds for a gas
Requires: cantera >= 3.0.0, matplotlib
import cantera as ct
import math
import numpy as np
import matplotlib.pyplot as plt


def equilSoundSpeeds(gas, rtol=1.0e-8, max_iter=5000):
    """
    Returns a tuple containing the equilibrium and frozen sound speeds for a
    gas with an equilibrium composition.  The gas is first set to an
    equilibrium state at the temperature and pressure of the gas, since
    otherwise the equilibrium sound speed is not defined.
    """

    # set the gas to equilibrium at its current T and P
    gas.equilibrate('TP', rtol=rtol, max_iter=max_iter)

    # save properties
    s0 = gas.s
    p0 = gas.P
    r0 = gas.density

    # perturb the pressure
    p1 = p0*1.0001

    # set the gas to a state with the same entropy and composition but
    # the perturbed pressure
    gas.SP = s0, p1

    # frozen sound speed
    afrozen = math.sqrt((p1 - p0)/(gas.density - r0))

    # now equilibrate the gas holding S and P constant
    gas.equilibrate('SP', rtol=rtol, max_iter=max_iter)

    # equilibrium sound speed
    aequil = math.sqrt((p1 - p0)/(gas.density - r0))

    # check against the built-in sound speed function
    afrozen2 = gas.sound_speed

    return aequil, afrozen, afrozen2
Calculate sound speed at a range of temperatures
gas = ct.Solution('gri30_highT.yaml')
gas.X = 'CH4:1.00, O2:2.0, N2:7.52'
T_range = np.arange(300, 5901, 200)
data = []
print('   T     Equilibrium  Frozen manual  Frozen built-in')
print('  [K]       [m/s]         [m/s]           [m/s]')
print('-------  -----------  -------------  ---------------')
for T in T_range:
    gas.TP = T, ct.one_atm
    aequil, afrozen, afrozen2 = equilSoundSpeeds(gas)
    data.append((T, aequil, afrozen, afrozen2))
    print(f'{T:6.1f}  {aequil:12.2f}  {afrozen:13.2f}  {afrozen2:15.2f}')
   T     Equilibrium  Frozen manual  Frozen built-in
  [K]       [m/s]         [m/s]           [m/s]
-------  -----------  -------------  ---------------
 300.0        351.82         351.82           351.83
 500.0        450.54         450.54           450.54
 700.0        528.57         528.57           528.58
 900.0        594.39         594.39           594.39
1100.0        653.02         653.03           653.03
1300.0        706.54         706.64           706.64
1500.0        755.61         756.33           756.34
1700.0        800.09         803.03           803.04
1900.0        839.27         847.59           847.60
2100.0        873.72         891.07           891.07
2300.0        906.65         934.86           934.86
2500.0        942.15         980.70           980.70
2700.0        982.98        1030.52          1030.52
2900.0       1030.57        1086.41          1086.41
3100.0       1086.27        1150.69          1150.69
3300.0       1151.17        1224.86          1224.87
3500.0       1224.11        1307.11          1307.11
3700.0       1300.74        1390.78          1390.78
3900.0       1375.91        1467.77          1467.77
4100.0       1446.46        1533.98          1533.99
4300.0       1509.89        1590.28          1590.29
4500.0       1562.67        1639.67          1639.68
4700.0       1603.00        1685.06          1685.07
4900.0       1633.63        1728.73          1728.74
5100.0       1659.84        1772.45          1772.45
5300.0       1686.34        1817.70          1817.70
5500.0       1716.15        1865.92          1865.92
5700.0       1751.02        1918.55          1918.55
5900.0       1792.09        1977.10          1977.10
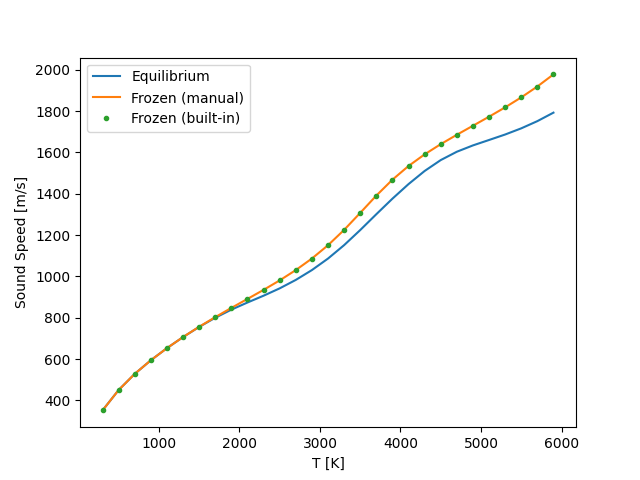
Plot results
data = np.array(data)
fig, ax = plt.subplots()
ax.plot(data[:,0], data[:,1], label='Equilibrium')
ax.plot(data[:,0], data[:,2], label='Frozen (manual)')
ax.plot(data[:,0], data[:,3], linestyle='none', marker='.', label='Frozen (built-in)')
ax.set(xlabel='T [K]', ylabel='Sound Speed [m/s]')
ax.legend()
plt.show()

Total running time of the script: (0 minutes 0.623 seconds)

