Note
Go to the end to download the full example code.
Critical state properties#
Print the critical state properties for the fluids for which Cantera has built-in liquid/vapor equations of state.
import cantera as ct
import matplotlib.pyplot as plt
Create PureFluid objects:
fluids = {'water': ct.Water(),
          'nitrogen': ct.Nitrogen(),
          'methane': ct.Methane(),
          'hydrogen': ct.Hydrogen(),
          'oxygen': ct.Oxygen(),
          'carbon dioxide': ct.CarbonDioxide(),
          'heptane': ct.Heptane(),
          'HFC-134a': ct.Hfc134a()
          }
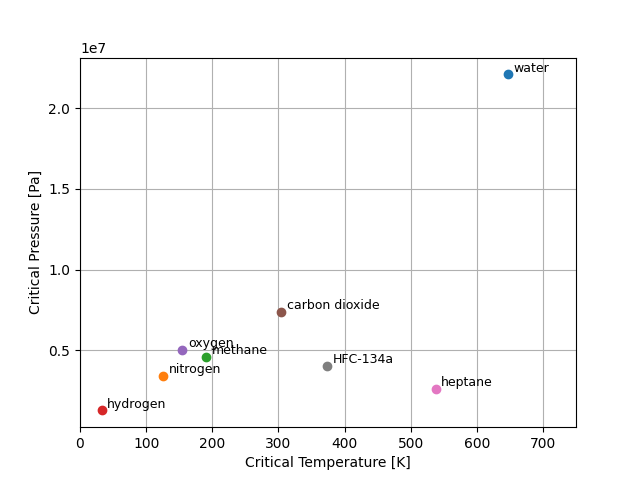
Plot critical properties and print tabulated values:
fig, ax = plt.subplots()

print('Critical State Properties')
print(f"{'Fluid':^16s}   {'Tc [K]':^7s}   {'Pc [Pa]':^10s}   {'Zc':^7s}")
print(f"{'-'*16}   {'-'*7}   {'-'*10}   {'-'*7}")
for name in fluids:
    f = fluids[name]
    tc = f.critical_temperature
    pc = f.critical_pressure
    rc = f.critical_density
    mw = f.mean_molecular_weight
    zc = pc * mw / (rc * ct.gas_constant * tc)
    ax.plot(tc, pc, 'o')
    ax.annotate(name, (tc, pc), (4, 2), textcoords='offset points', size=9)
    print(f'{name:16s}   {tc:7.2f}   {pc:10.4g}   {zc:7.4f}')

ax.set(xlabel='Critical Temperature [K]', ylabel='Critical Pressure [Pa]')
ax.set(xlim=(0, 750))
ax.grid(True)
plt.show()

Critical State Properties
     Fluid         Tc [K]     Pc [Pa]       Zc
----------------   -------   ----------   -------
water               647.29    2.209e+07    0.2333
nitrogen            126.20      3.4e+06    0.2891
methane             190.56    4.599e+06    0.2904
hydrogen             32.94    1.284e+06    0.3013
oxygen              154.58    5.043e+06    0.2879
carbon dioxide      304.21    7.384e+06    0.2769
heptane             537.68     2.62e+06    0.2972
HFC-134a            374.21    4.059e+06    0.2600
Total running time of the script: (0 minutes 0.160 seconds)

