Note
Go to the end to download the full example code.
Converging-Diverging Nozzle#
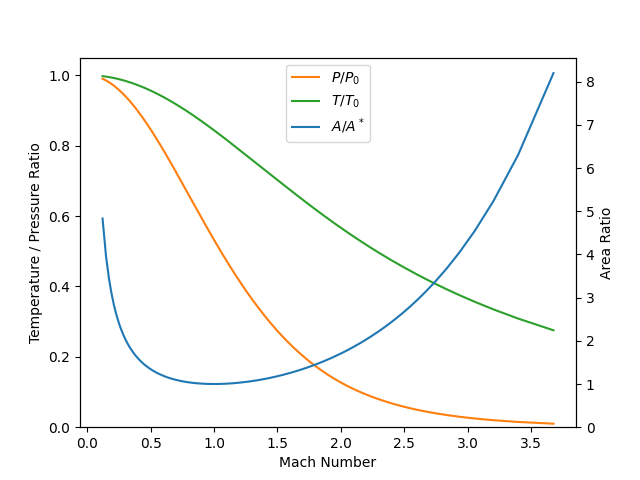
Calculate the area ratio vs. Mach number curve for a mixture accelerating to supersonic speed through a converging–diverging nozzle, assuming isentropic, adiabatic flow.
The calculations are done for a 10:1 hydrogen/nitrogen mixture with stagnation temperature of 1200 K and a stagnation pressure of 10 atm.
Requires: cantera >= 2.5.0, matplotlib >= 2.0
import cantera as ct
import math
import numpy as np
import matplotlib.pyplot as plt
Set initial conditions and get stagnation state parameters:
To calculate the state at different points, we can take pressure as the independent variable and set the state of the gas based on that pressure and the entropy, which is constant (\(s = s_0\)) by the isentropic assumption. Assuming an adiabatic flow, the total enthalpy is constant, which gives us an equation that can be solved for the velocity:
Finally, conservation of mass requires:
which gives us an equation that can be solved for the area.
mdot = 1  # arbitrary
n_points = 200
data = np.zeros((n_points, 4))

for i, p in enumerate(np.linspace(0.01 * p0, 0.99*p0, n_points)):
    # set the state using (s0, p)
    gas.SP = s0, p

    v = np.sqrt(2.0*(h0 - gas.h))  # h + V^2/2 = h0
    area = mdot / (gas.density * v)  # rho*v*A = constant
    Ma = v/gas.sound_speed
    data[i, :] = [area, Ma, gas.T/T0, p/p0]

# Normalize by the minimum area (nozzle throat)
data[:, 0] /= min(data[:, 0])
Plot the results:
fig, ax = plt.subplots()
h1 = ax.plot(data[:, 1], data[:, 3], 'C1', label='$P/P_0$')
h2 = ax.plot(data[:, 1], data[:, 2], 'C2', label='$T/T_0$')
ax.set(xlabel='Mach Number', ylabel='Temperature / Pressure Ratio',
       ylim=(0, 1.05))
ax2 = ax.twinx()
h3 = ax2.plot(data[:, 1], data[:, 0], label='$A/A^*$')
ax2.set(ylabel='Area Ratio', ylim=(0,None))
ax.legend(handles=[h1[0], h2[0], h3[0]], loc='upper center')
plt.show()

Total running time of the script: (0 minutes 0.229 seconds)

